
 Please check your email for your login details.
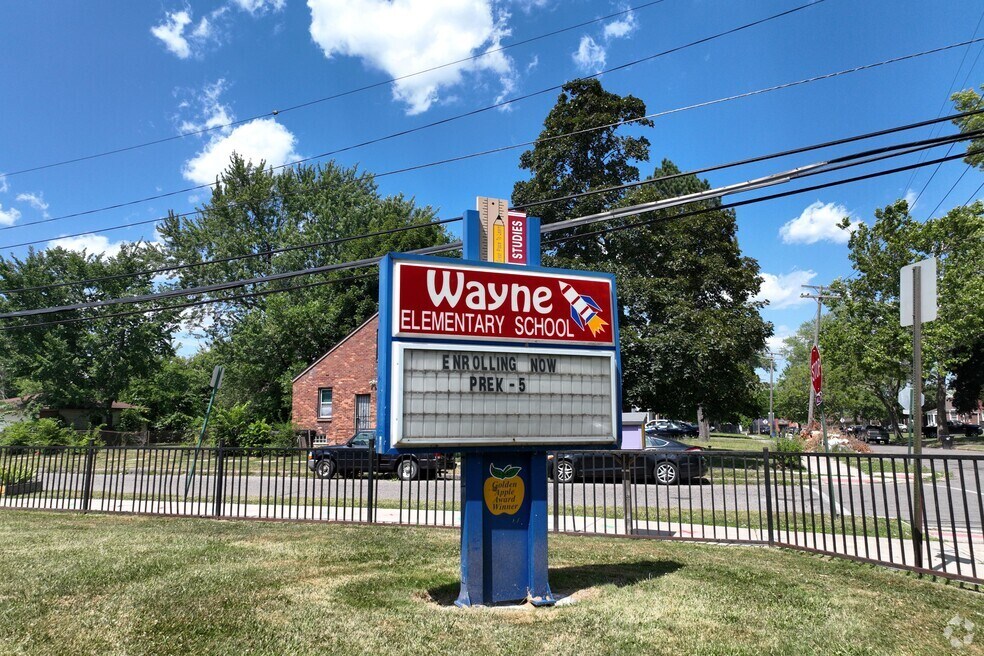
Wayne Elementary School
Public Pre-K, Elementary School|Grade Pre-K-5
10633 Courville St, Detroit, MI
Outer Drive-Hayes Neighborhood
Detroit Public Schools Community School District
School Details
| Head of School | Student Teacher Ratio |
| Principal Senta Ray-conley | 15:1 |
| Math Proficiency | Reading Proficiency |
| 7.5% | 7.5% |
Niche Grade Details
Academics
| Students Per Counselor | Math Proficiency |
| 7.5% | 7.5% |
Teachers
| Student Teacher Ratio Teachers | Full Time Teachers |
| 15:1 16 | 16 |
| Teachers in First or Second Year | |
| 17.6% |
GreatSchools Rating Details
Teachers and Staff
| Students Per Counselor |
| 296:1 |
Student Diversity
| Male | Female | Black |
| 52.7% | 47.3% | 99.2% |
| Two or more races | Hispanic | |
| <1% | <1% |
Interested in learning more about homes nearby? Reach out to Roland Walker, an experienced agent in this school’s attendance zone.
Specialty School Programs
Free/Reduced Lunch Offered
Agents Specializing in this Area


Map
About Outer Drive-Hayes
Von Steuben is a residential neighborhood in northeast Detroit, approximately 10 miles from downtown. Named after Revolutionary War hero Friedrich Wilhelm von Steuben, the area reflects its historical roots through street names like Hamburg, Strasburg, and Dresden. The neighborhood features 1940s-era brick Tudor-style homes, bungalows, and ranch-style houses, offering affordable options for first-time homebuyers and investors. With a population of around 4,269, the community is predominantly African American and maintains a suburban feel with tree-lined streets and local parks.
| List Price Range | Homes For Sale | Average Home Value | Median Lot Size |
| $27K – $171K | 42 | $73,599 | 4,791 Sq Ft |
| % Renters | Household Income | % of College Grads | Median Age |
| 48% | $40,897 | 6.1% | 35 |
| Average House Size | % Commercial Property | ||
| 1,409 Sq Ft | 23.9% |
Homes for Sale
See All Homes
Home Trends
Home Sales Trends
| Median Sale Price | Median Single Family Price | Average Price Per Sq Ft | Number of Homes for Sale |
| $58,000 | $74,900 | $63 | 42 |
| Last 12 months Home Sales | Months of Supply | Median List Price | Median Change From 1st List Price |
| 114 | 4.4 | $78,000 | 9% |
| Median Home Sale Price YoY Change | |||
| 9% |
Distribution of Home Values
Neighborhood Facts
| Number of Homes in Neighborhood | Median Year Built | Avg. Single Family Home Size Sq Ft Significantly below the national average | Median Lot Size Sq Ft |
| 3,941 | 1939 | 1,409 1,936 | 4,791 |
Demographics
Area Demographics
| Total Population | Population Density | Median Age | Population under 18 On par with the national average |
| 10,435 | 12 ppl/acre | 35 | 29.9% 23.8% |
| Population over 65 On par with the national average | |||
| 14.7% 19.1% |
Finances
| Median Household Income Significantly below the national average | Average Household Income |
| $34,316 $71,702 | $40,897 |
Education and Workforce
| High School Graduates Below the national average | College Graduates Below the national average | Advanced Degrees | % Population in Labor Force |
| 74.8% 89.1% | 6.1% 34.1% | 2.8% | 53.3% |
Rmc Building Company Llc