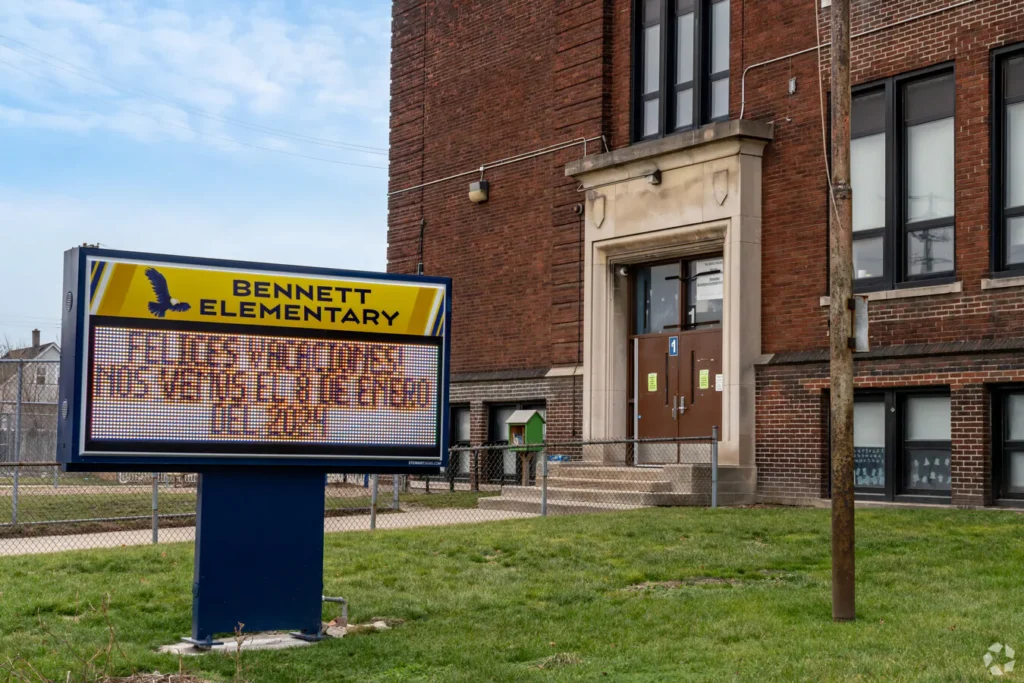
Bennett Elementary School
Public Pre-K, Elementary School|Grade Pre-K-5
2111 Mullane St, Detroit, MI
Springwells Neighborhood
Detroit Public Schools Community School District
398
Students
C
Niche Grade
3
Great Schools
School Details
| Head of School | Student Teacher Ratio | Math Proficiency |
| Principal Dina Bonomo | 15:1 | 16% |
| Reading Proficiency | ||
| 16% |
Niche Grade Details
Academics
| Reading Proficiency | Math Proficiency |
| 16% | 16% |
Teachers
| Student Teacher Ratio Teachers | Full Time Teachers |
| 15:1 26 | 26 |
| Teachers in First or Second Year | |
| 23.1% |
GreatSchools Rating Details
Teachers and Staff
| Students Per Counselor |
| 465:1 |
Student Diversity
| Male | Female | Hispanic |
| 51% | 49% | 77.6% |
| Black | White | Two or more races |
| 11.1% | 10.1% | <1% |
| Native American | ||
| <1% |
Interested in learning more about homes nearby? Reach out to Jennifer Aparicio, an experienced agent in this school’s attendance zone.
Specialty School Programs
Free/Reduced Lunch Offered
Agents Specializing in this Area
Map
About Springwells
Springwells is a vibrant and historic neighborhood located in southwest Detroit, approximately 5 miles from Downtown. Bounded by Fort Street to the north, John Kronk Street to the south, Woodmere Street to the east, and Waterman Street to the west, it is home to nearly 17,000 residents.
The neighborhood boasts a rich cultural tapestry, with a significant Hispanic population alongside African American, Native American, Appalachian, and Arab American communities. This diversity is reflected in the area’s numerous Mexican restaurants, grocery stores, and businesses, as well as in community events and public art installations.
Architecturally, Springwells features early 20th-century homes, including bungalows and American Foursquares, many of which have been restored. The West Vernor–Springwells Historic District, added to the National Register of Historic Places in 2002, showcases a concentration of early 20th-century commercial buildings and landmarks like the Odd Fellows Hall.
Community engagement is strong, with organizations like Urban Neighborhood Initiatives leading revitalization efforts, including housing development and youth programs. The neighborhood’s walkability, access to parks like Patton Park, and proximity to amenities make it an attractive option for families and individuals seeking a dynamic urban environment.
With its rich history, cultural diversity, and active community involvement, Springwells offers residents a neighborhood that honors its past while building a vibrant future.
| List Price Range | Homes For Sale | Average Home Value | Median Lot Size |
| $54K – $218K | 4 | $92,973 | 3,484 Sq Ft |
| % Renters | Household Income | % of College Grads | Median Age |
| 50% | $46,393 | 5.8% | 32 |
| Average House Size | % Commercial Property | ||
| 2,429 Sq Ft | 53.5% |
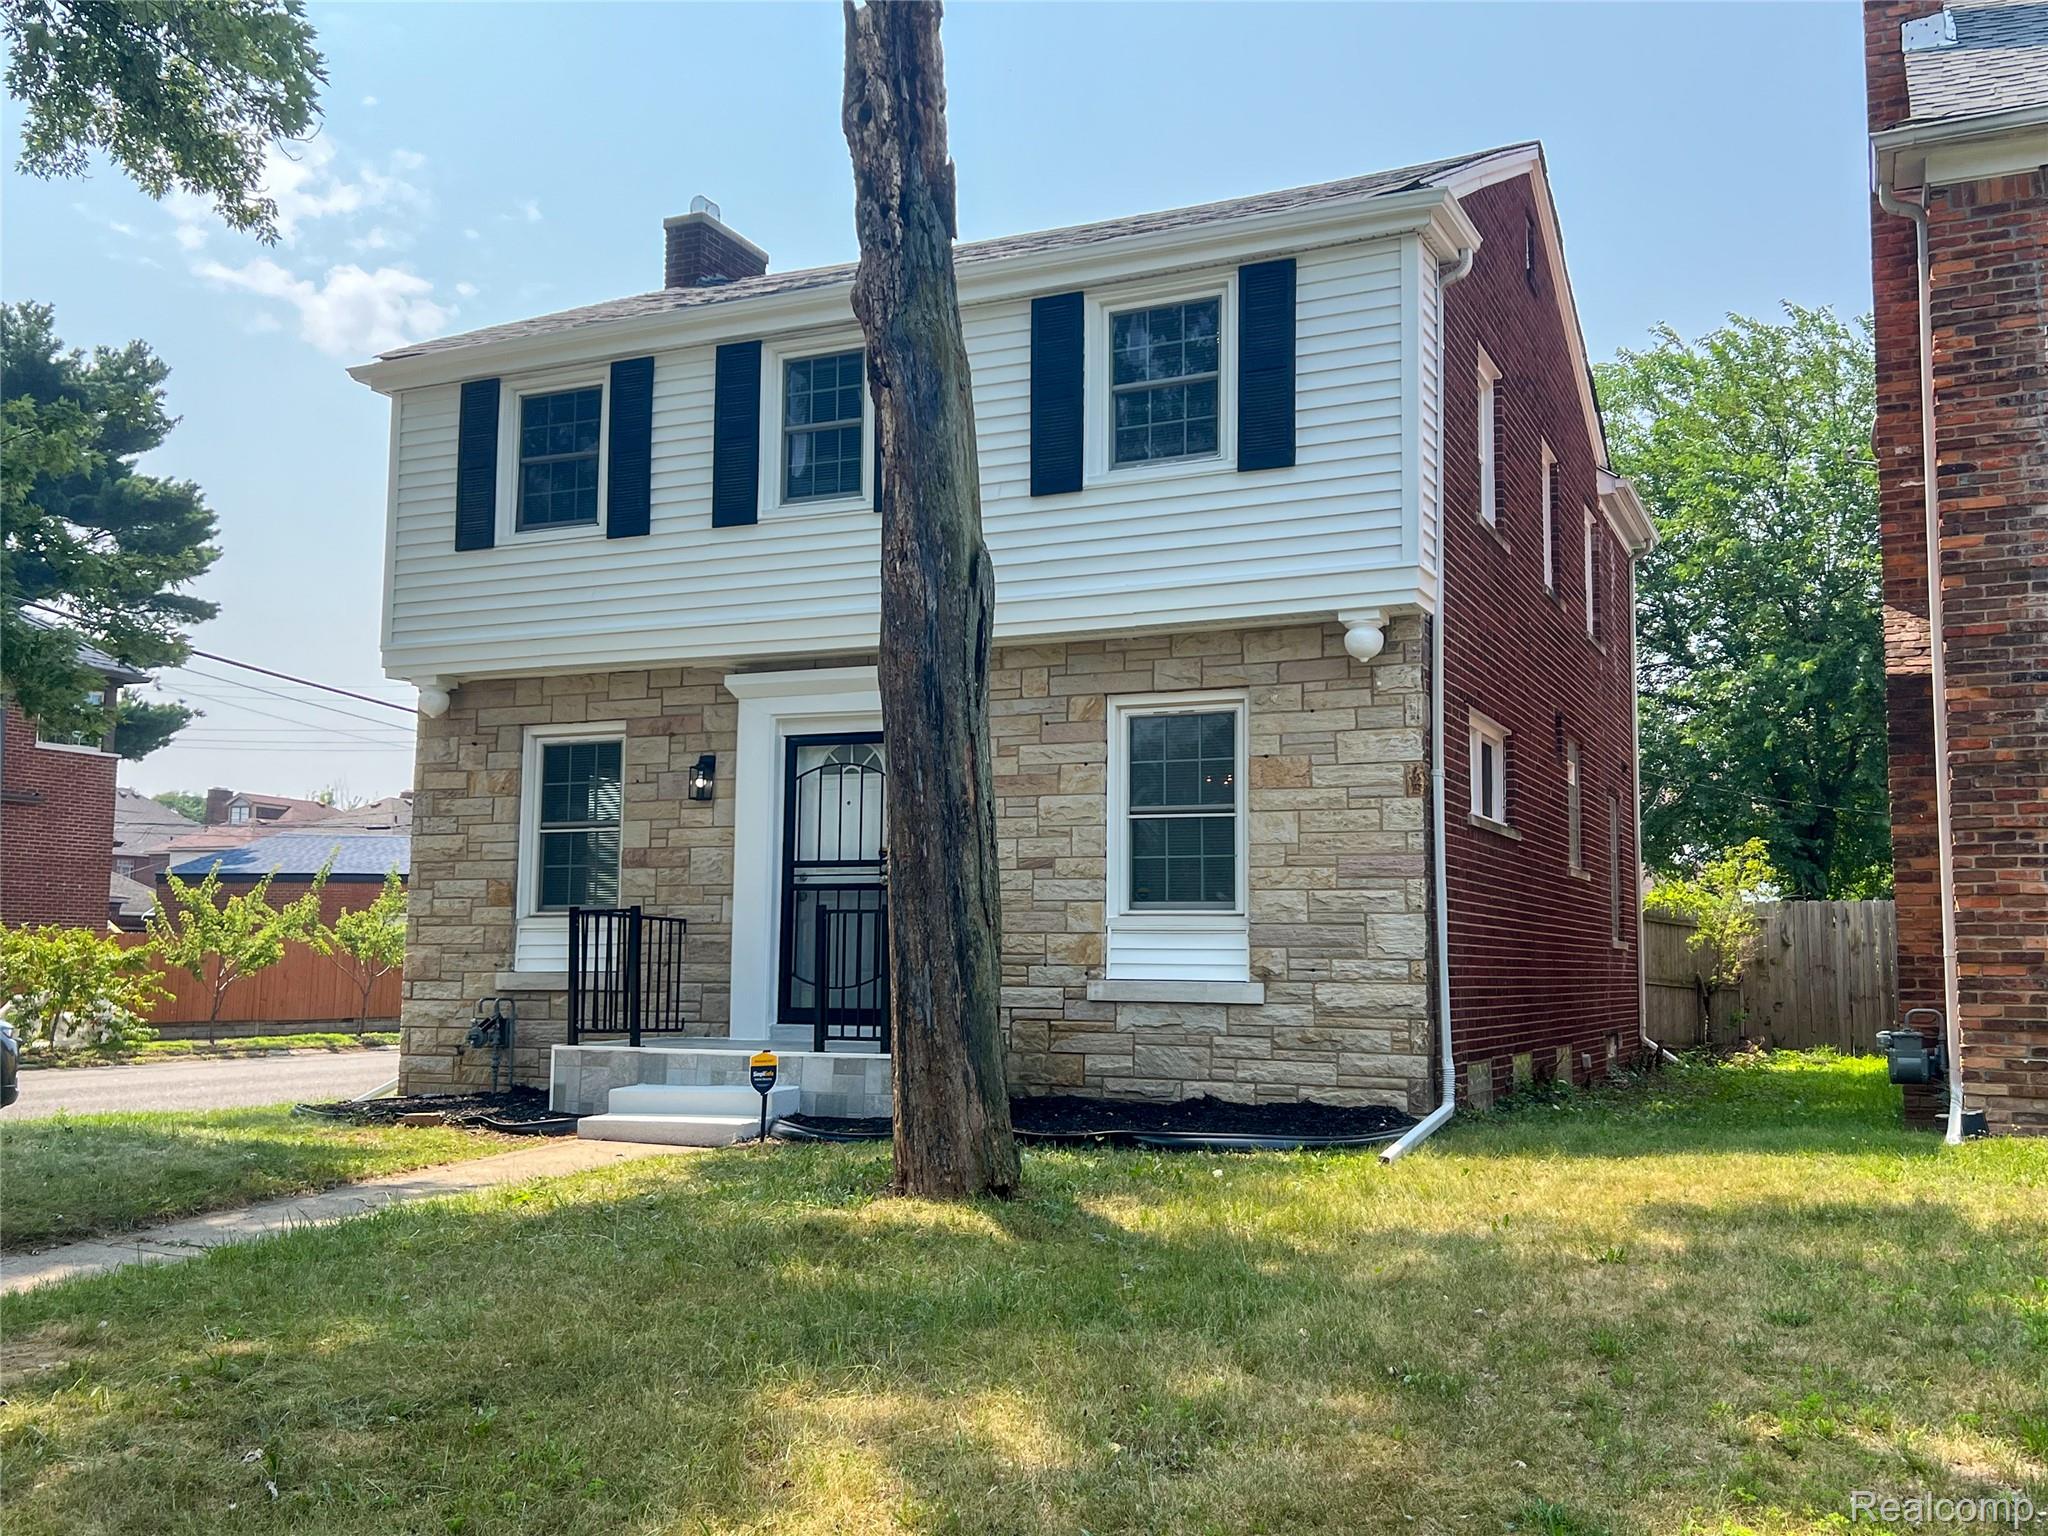
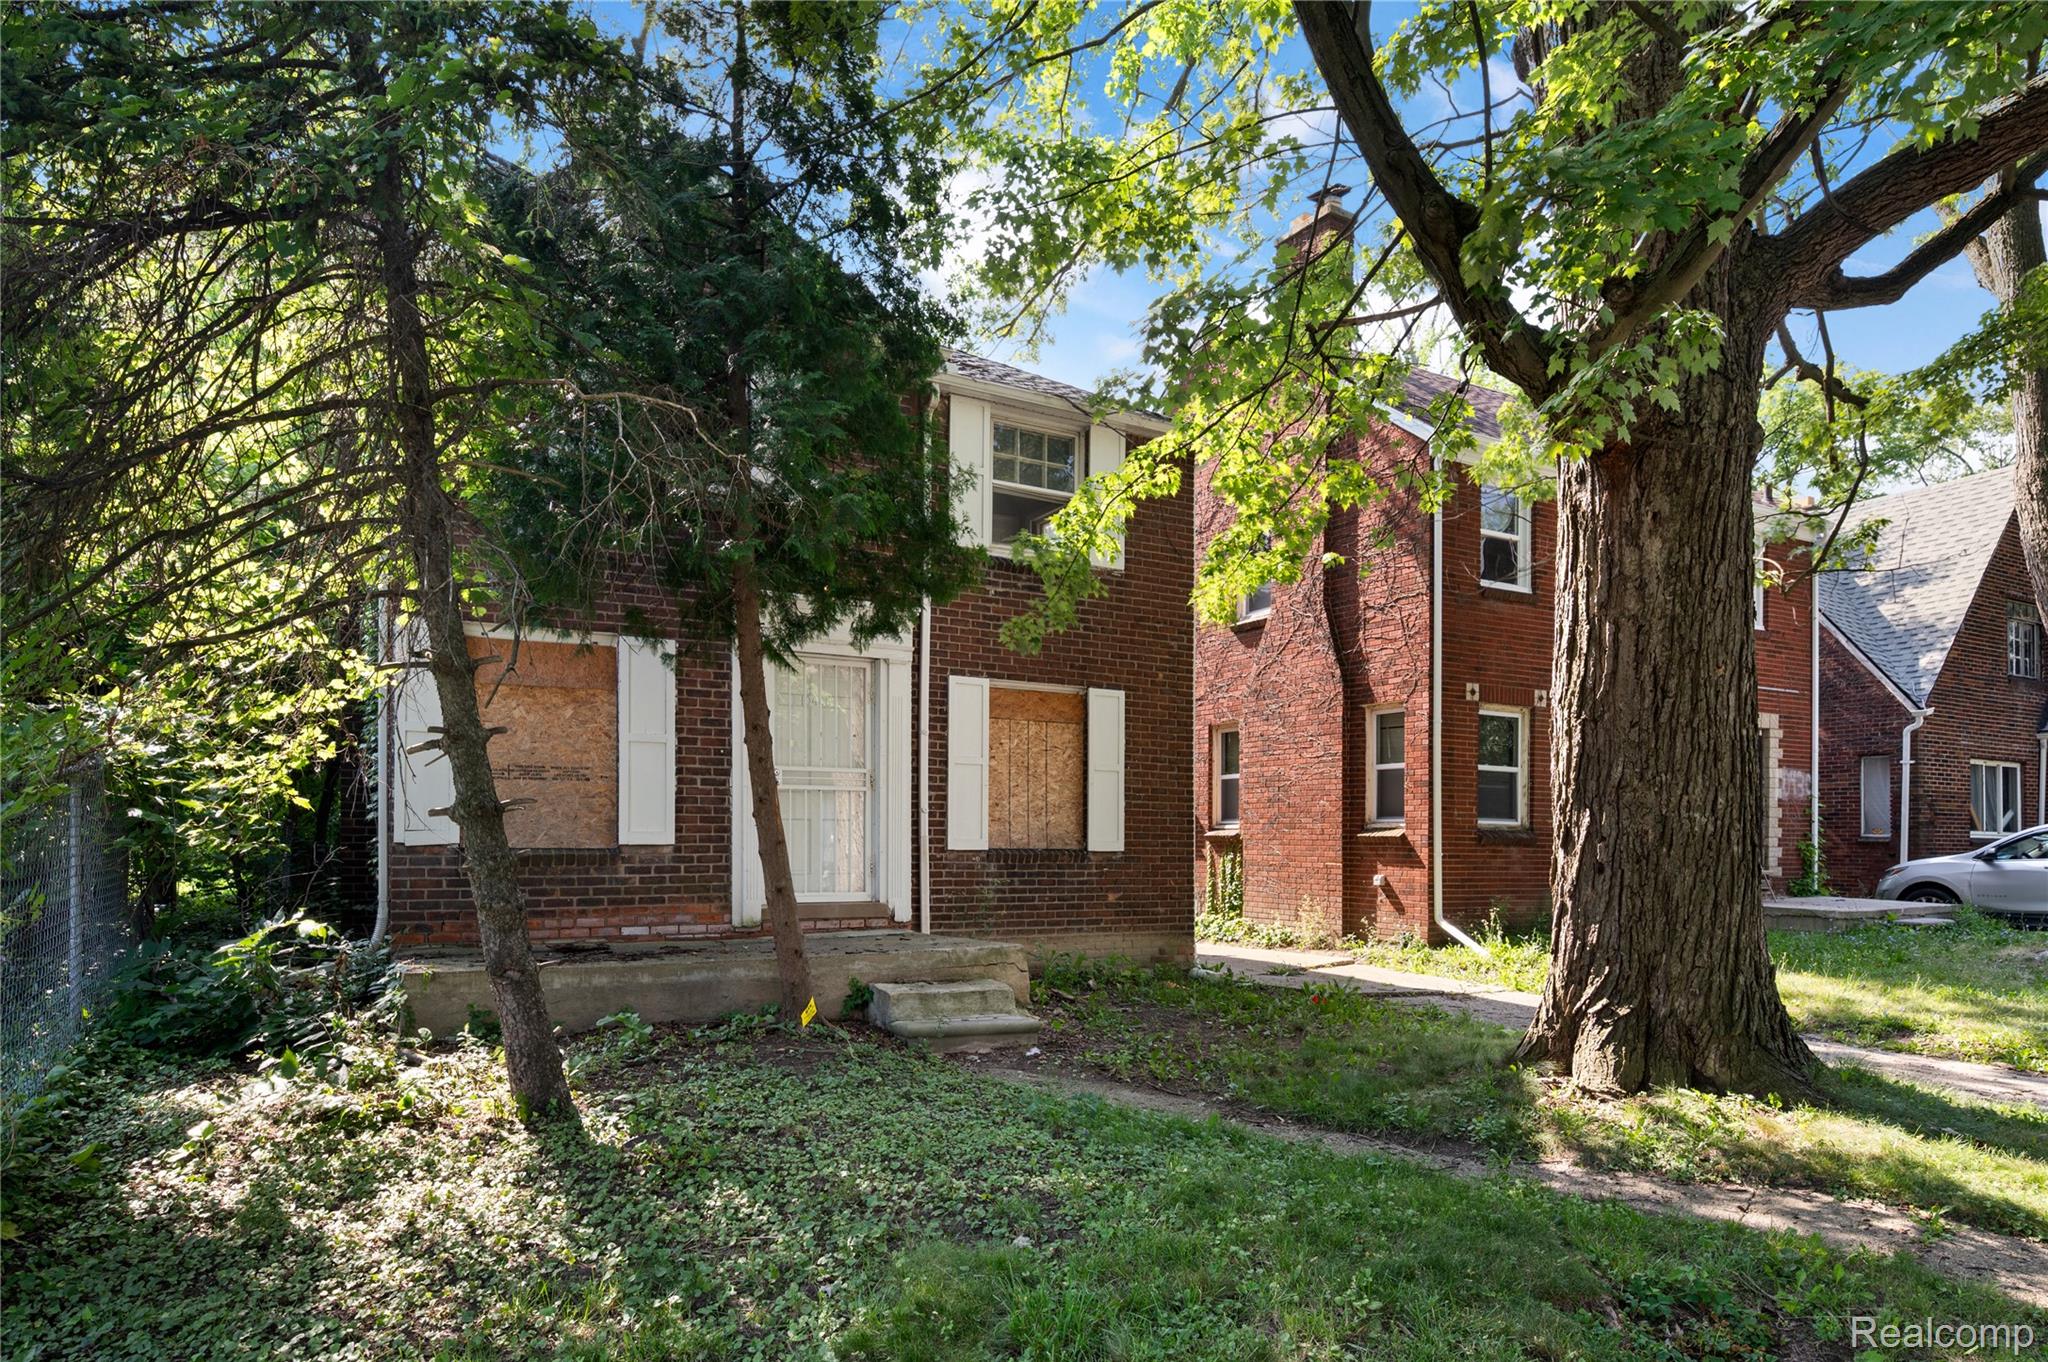
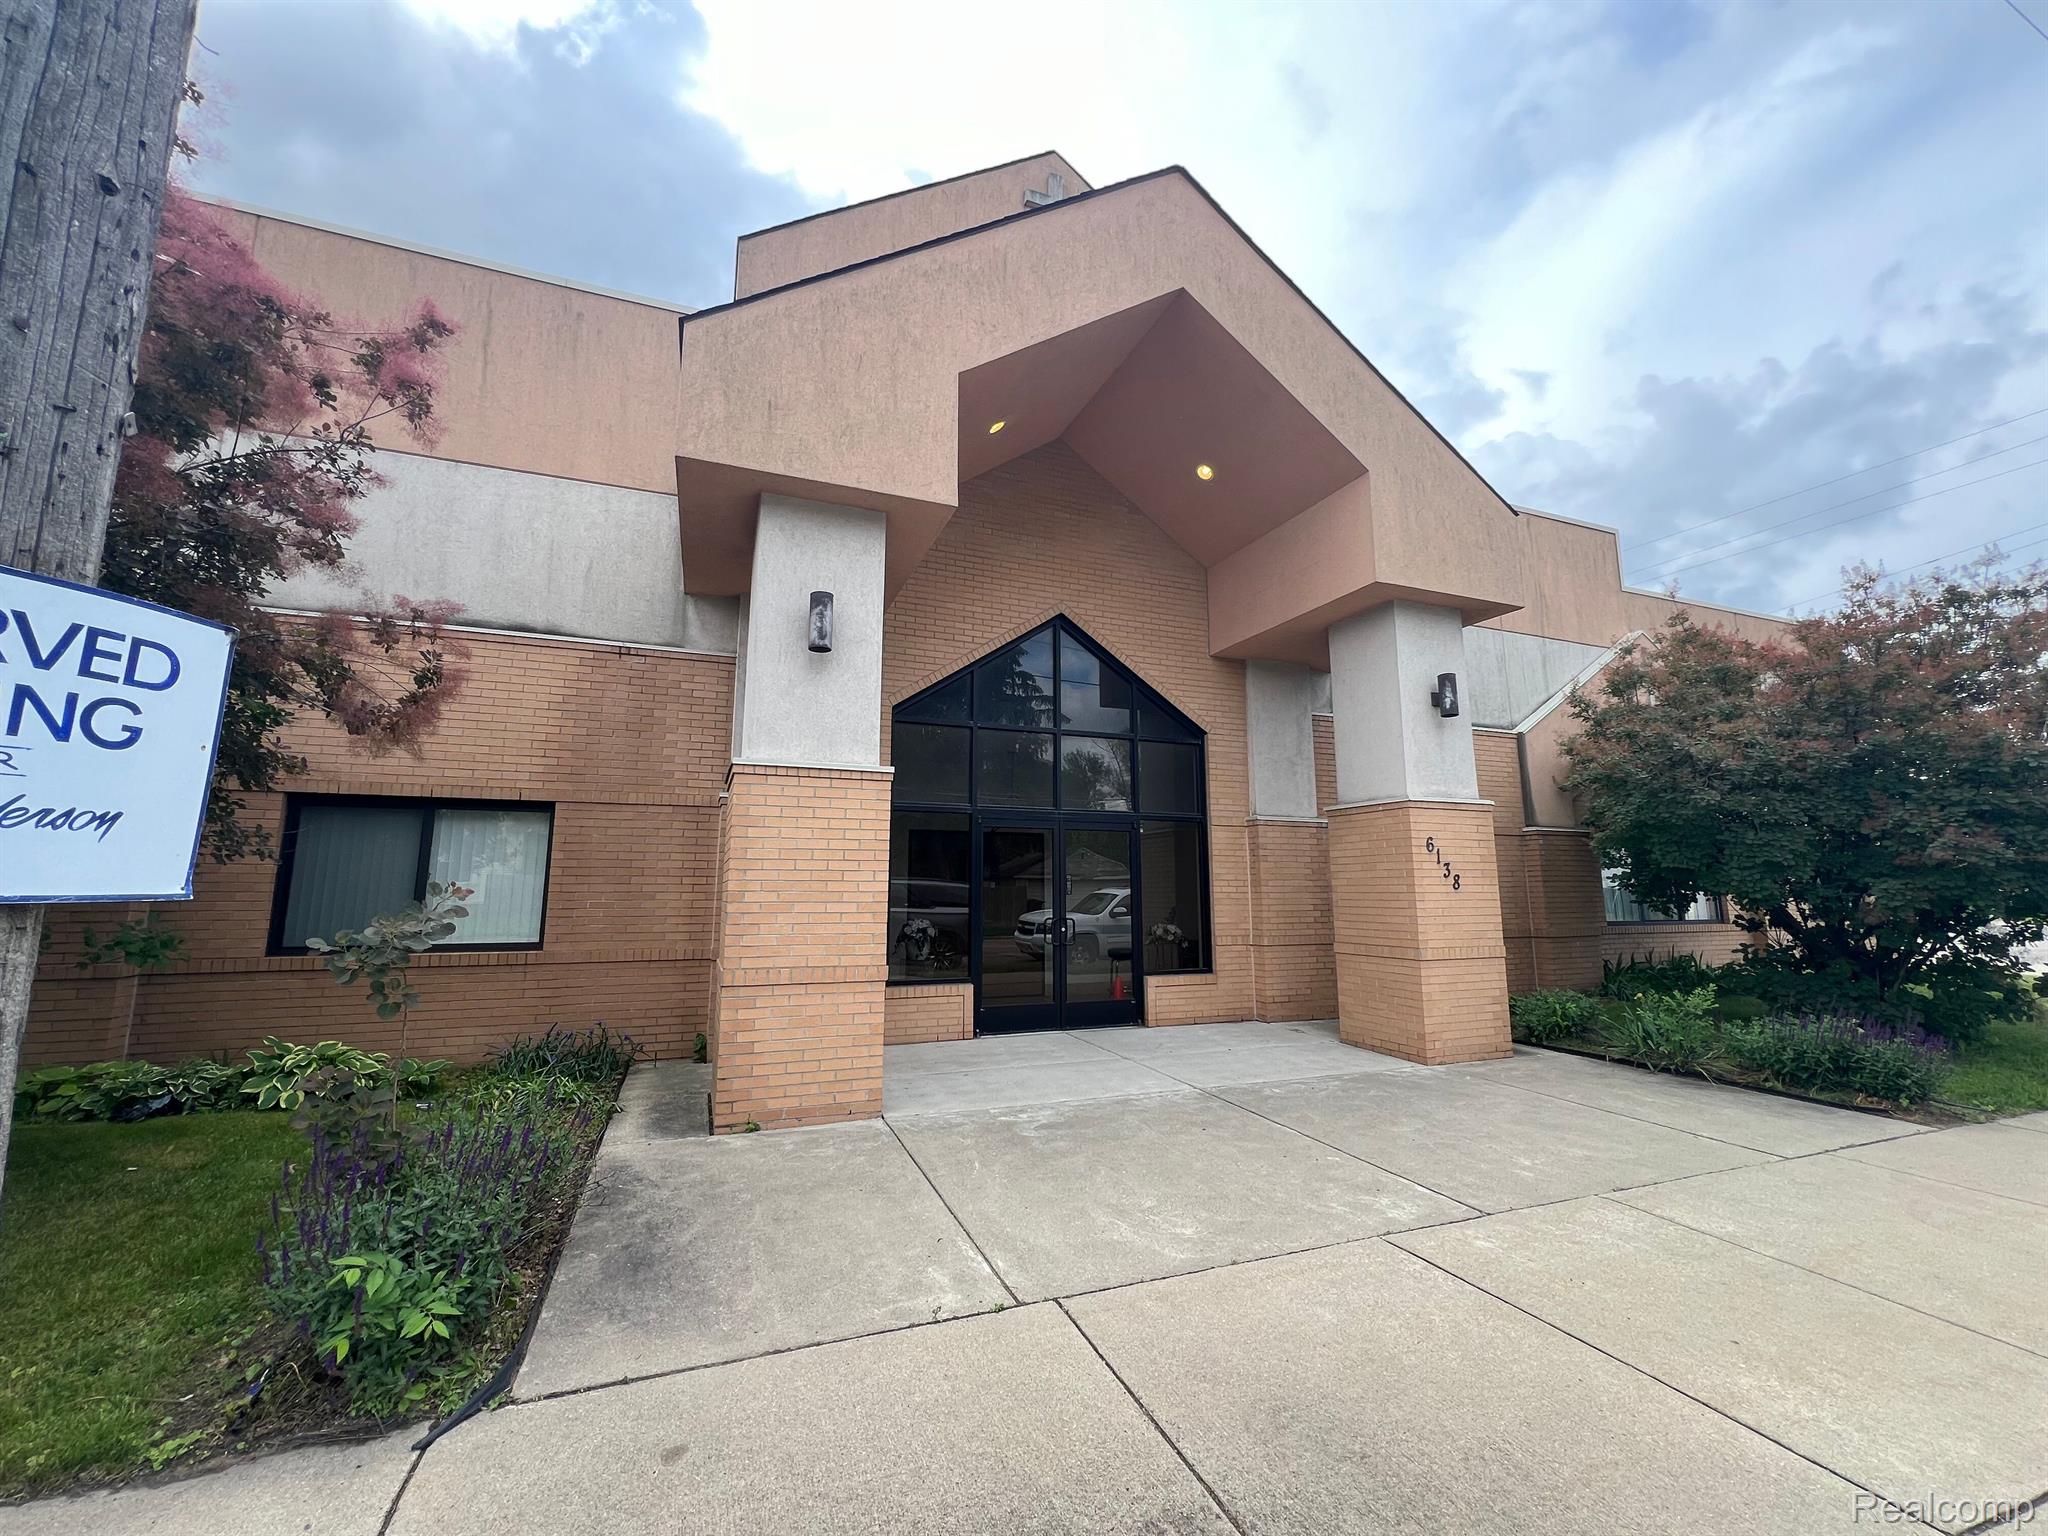
Homes for Sale
See All Homes
Home Trends
Home Sales Trends
| Median Sale Price | Median Single Family Price | Average Price Per Sq Ft | Number of Homes for Sale |
| $110,000 | $120,750 | $96 | 4 |
| Last 12 months Home Sales | Months of Supply | Median List Price | Median Change From 1st List Price |
| 23 | 2.1 | $124,900 | 0% |
| Median Home Sale Price YoY Change | |||
| -4% |
Distribution of Home Values
Neighborhood Facts
| Number of Homes in Neighborhood | Median Year Built | Avg. Single Family Home Size Sq Ft Significantly below the national average | Average 2 Bedroom Size Sq Ft |
| 1,410 | 1912 | 3,496 1,938 | 1,681 |
| Median Lot Size Sq Ft | |||
| 7,405 |
Demographics
Area Demographics
| Total Population | Population Density | Median Age | Population under 18 On par with the national average |
| 3,578 | 8 ppl/acre | 32 | 32.4% 23.8% |
| Population over 65 On par with the national average | |||
| 10.1% 19.1% |
Finances
| Median Household Income Significantly below the national average | Average Household Income |
| $35,057 $71,702 | $46,393 |
Education and Workforce
| High School Graduates Significantly below the national average | College Graduates Below the national average | Advanced Degrees | % Population in Labor Force |
| 57.1% 89.1% | 5.8% 34.1% | 0.6% | 54.7% |


 Please check your email for your login details.


