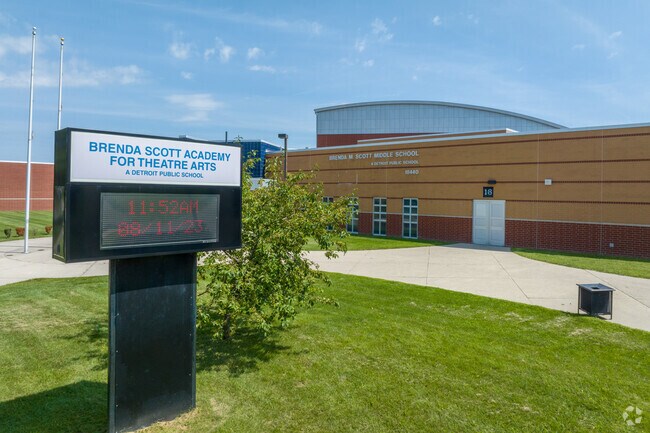
Brenda Scott Academy
Public Elementary, Middle School|Grade K-8
18440 Hoover St, Detroit, MI
Von Steuben Neighborhood
Detroit Public Schools Community School District
737
Students
C-
Niche Grade
3
Great Schools
School Details
| Head of School | Student Teacher Ratio | Math Proficiency |
| Principal Eric Redwine | 21:1 | 1% |
| Reading Proficiency | ||
| 7% |
Niche Grade Details
Academics
| Reading Proficiency | Math Proficiency |
| 7% | 1% |
Teachers
| Student Teacher Ratio Teachers | Full Time Teachers |
| 21:1 38 | 38 |
| Teachers in First or Second Year | |
| 18.2% |
GreatSchools Rating Details
Teachers and Staff
| Students Per Counselor |
| 362:1 |
Student Diversity
| Female | Male | Black |
| 51.2% | 48.8% | 98.7% |
| Hispanic | White | Native Hawaiian or Other Pacific Islander |
| <1% | <1% | <1% |
| Asian or Pacific Islander | ||
| <1% |
Interested in learning more about homes nearby? Reach out to Jennifer Hemstrom, an experienced agent in this school’s attendance zone.
Specialty School Programs
Free/Reduced Lunch Offered
Agents Specializing in this Area
Map
About Von Steuben
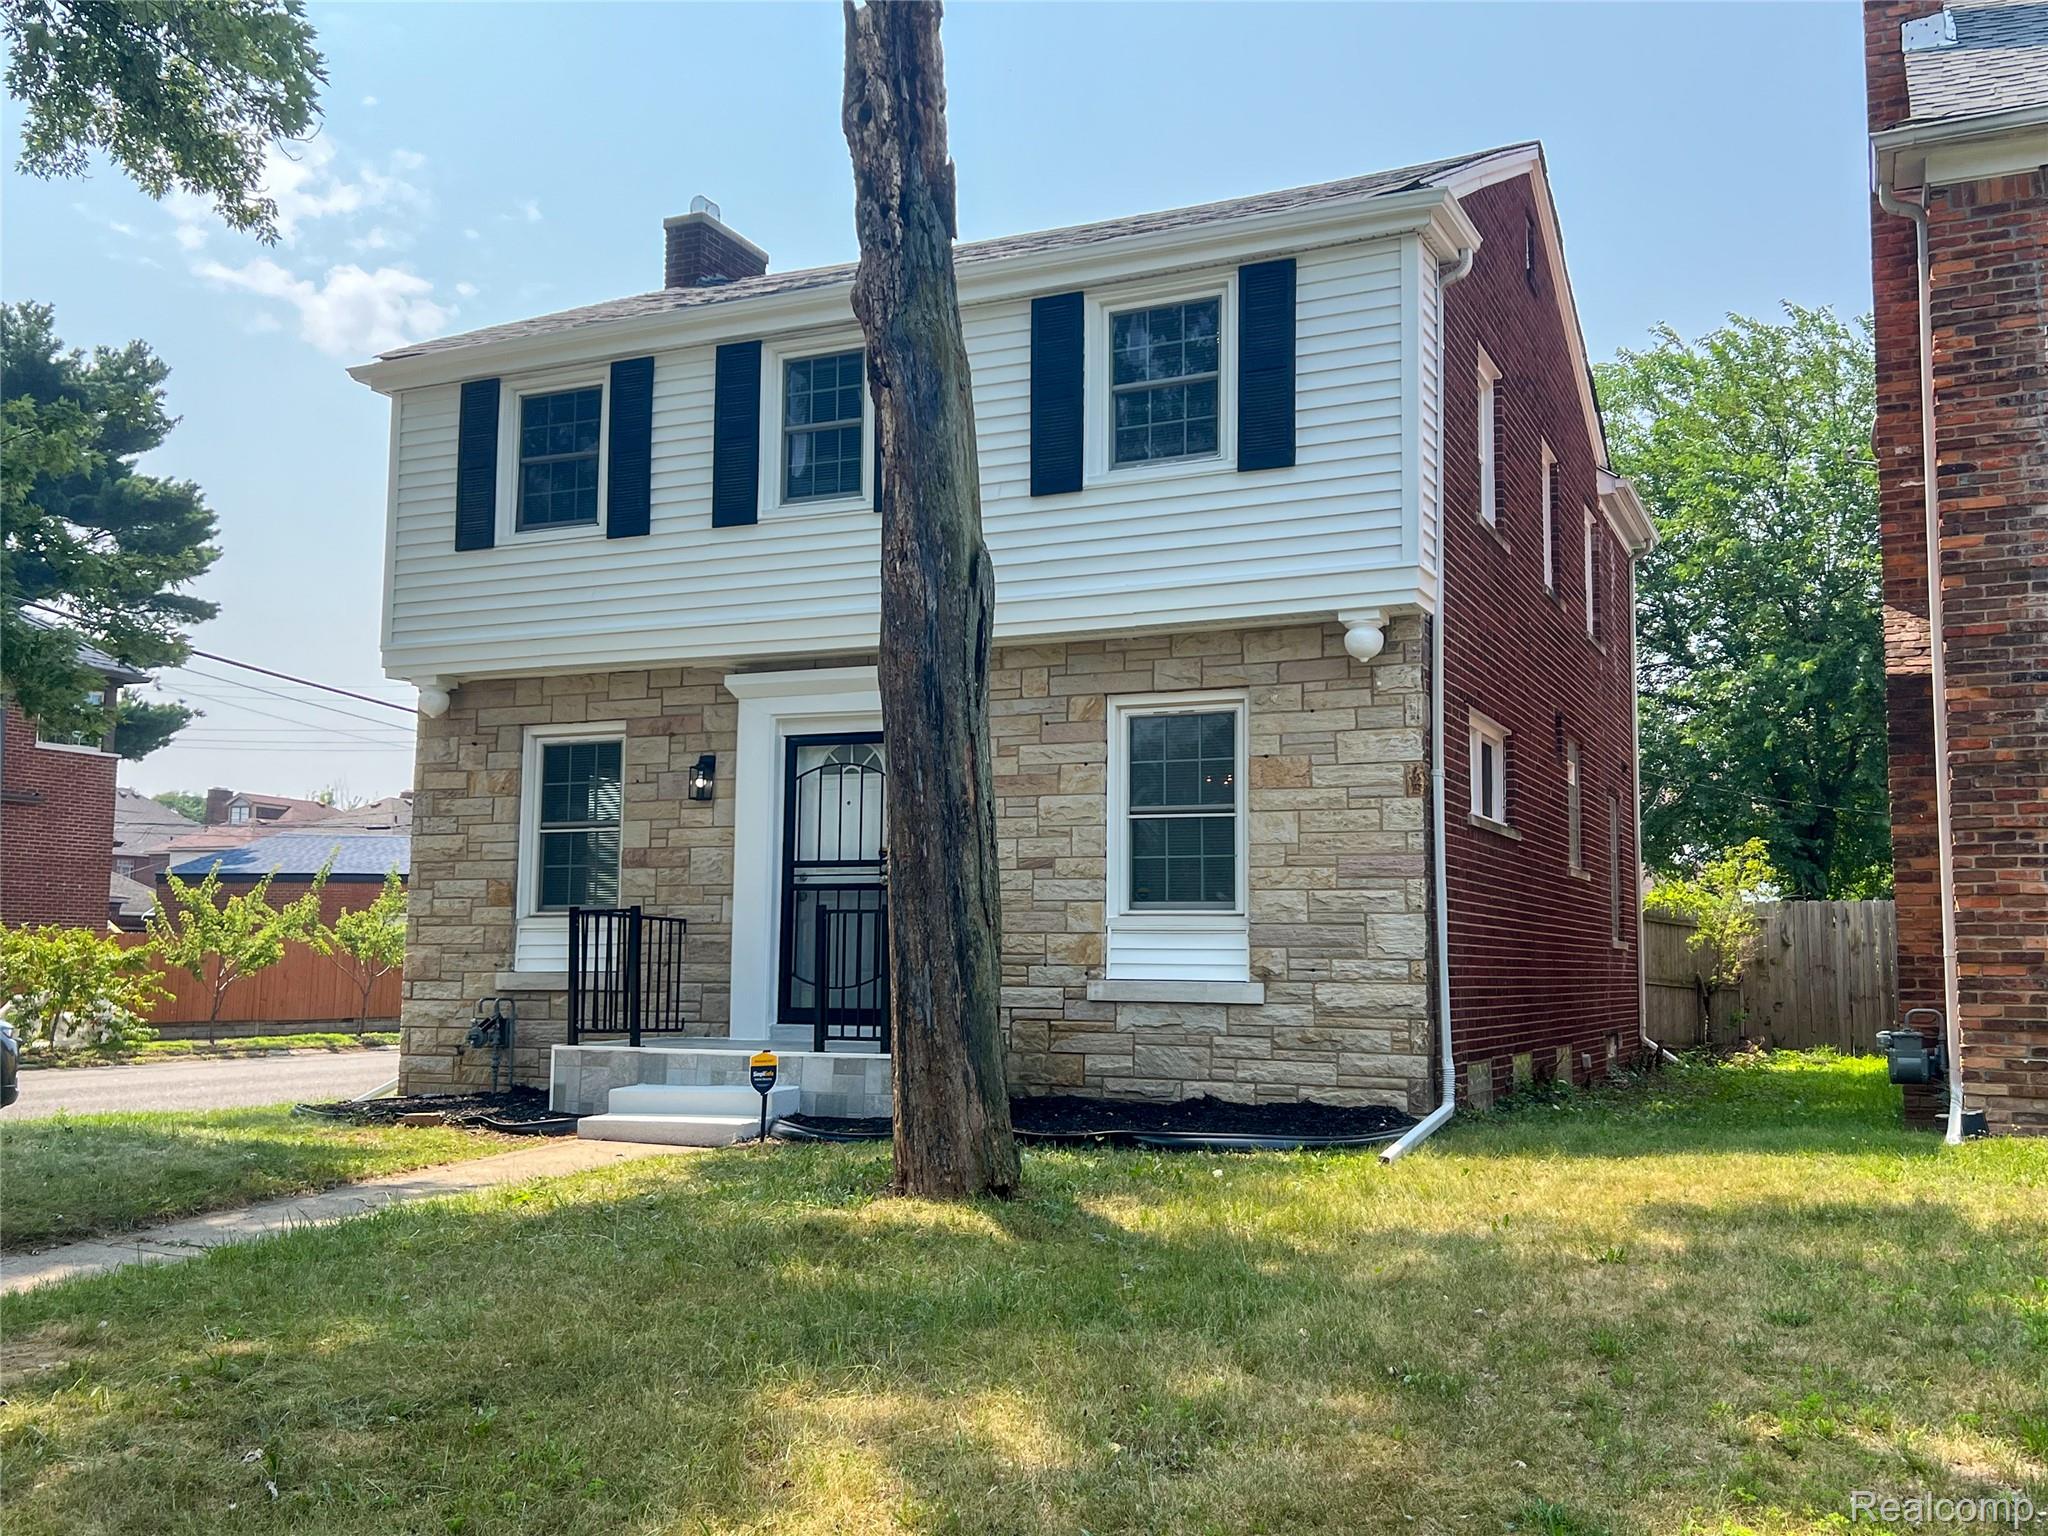
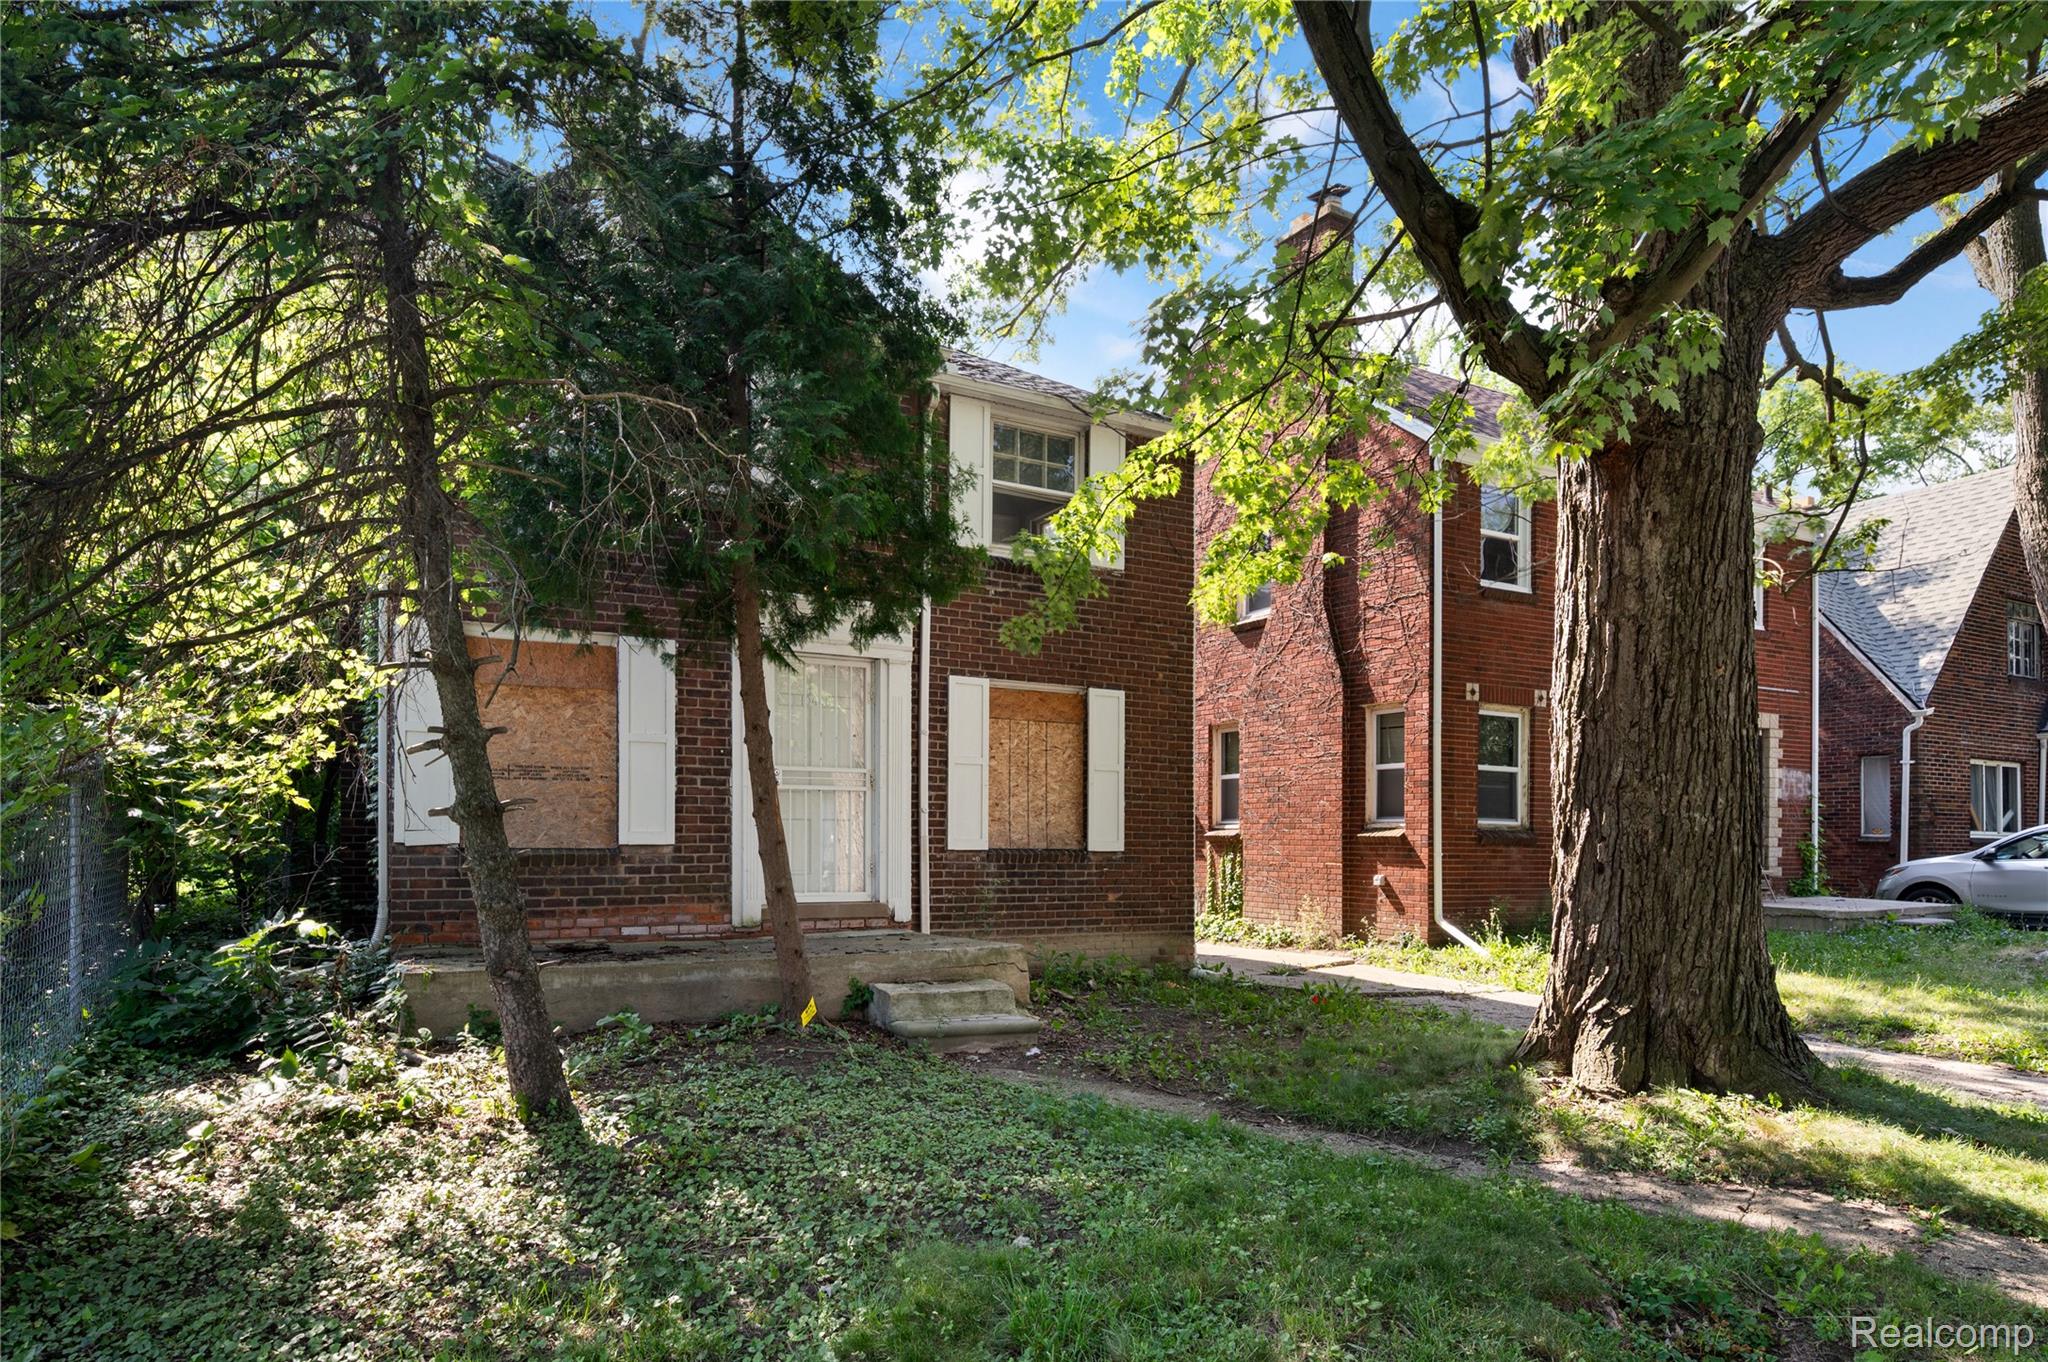
Von Steuben is a residential neighborhood on Detroit’s northeast side, known for its 1940s-era brick Tudors, bungalows, and ranch homes. Located about 10 miles from Downtown, it offers affordable housing and a quiet, suburban atmosphere. Families enjoy nearby parks like Optimist-Parkgrove Playground and access to schools such as Brenda Scott Academy and Osborn High. With a strong sense of community and convenient access to I-94 and Gratiot Avenue, Von Steuben is a stable and accessible Detroit neighborhood.
| List Price Range | Homes For Sale | Average Home Value | Median Lot Size |
| $30K – $149K | 27 | $70,073 | 4,791 Sq Ft |
| % Renters | Household Income | % of College Grads | Median Age |
| 47% | $46,264 | 5.4% | 35 |
| Average House Size | % Commercial Property | ||
| 1,459 Sq Ft | 16.4% |
Homes for Sale
See All Homes
Home Trends
Home Sales Trends
| Median Sale Price | Median Single Family Price | Average Price Per Sq Ft | Number of Homes for Sale |
| $70,000 | $73,000 | $71 | 27 |
| Last 12 months Home Sales | Months of Supply | Median List Price | Median Change From 1st List Price |
| 45 | 7.2 | $75,000 | 7% |
| Median Home Sale Price YoY Change | |||
| 47% |
Distribution of Home Values
Neighborhood Facts
| Number of Homes in Neighborhood | Median Year Built | Avg. Single Family Home Size Sq Ft Significantly below the national average | Average 2 Bedroom Size Sq Ft |
| 2,069 | 1943 | 1,459 1,938 | 4,791 |
Demographics
Area Demographics
| Total Population | Population Density | Median Age | Population under 18 On par with the national average |
| 5,305 | 11 ppl/acre | 35 | 29.3% 23.8% |
| Population over 65 On par with the national average | |||
| 14.6% 19.1% |
Finances
| Median Household Income Significantly below the national average | Average Household Income |
| $39,283 $71,702 | $46,264 |
Education and Workforce
| High School Graduates | College Graduates Below the national average | Advanced Degrees Below the national average | % Population in Labor Force |
| 88.4% | 5.4% 34.1% | 1.3% 13.3% | 64.4% |


 Please check your email for your login details.


