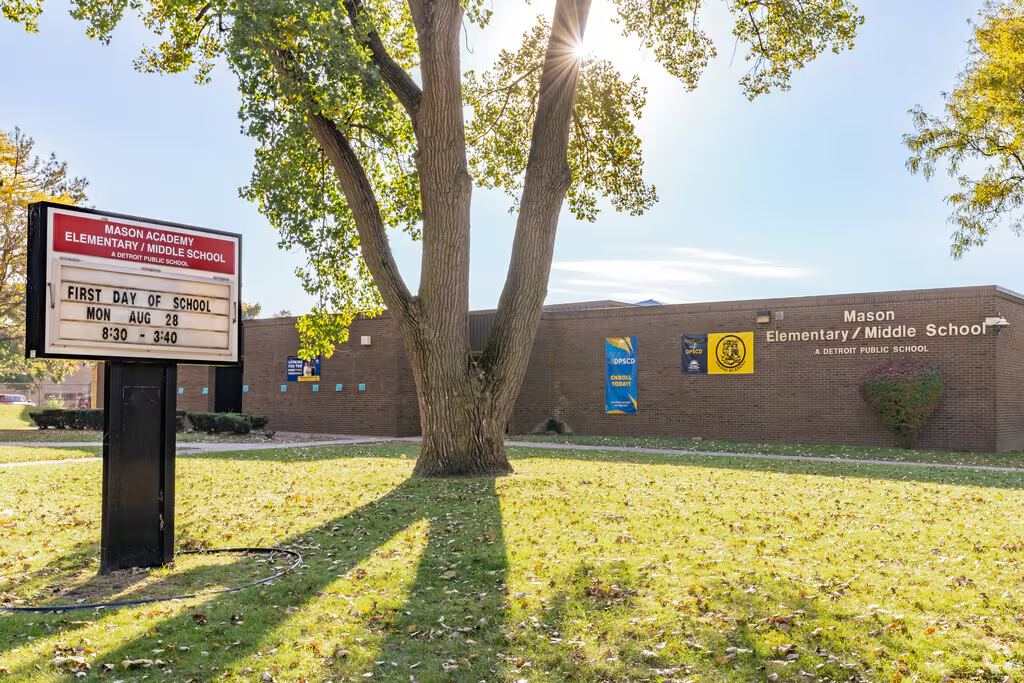
Mason Academy
Public Pre-K, Elementary, Middle School|Grade Pre-K-8
19955 Fenelon St, Detroit, MI
Farwell Neighborhood
Detroit Public Schools Community School District
368
Students
C-
Niche Grade
3
Great Schools
School Details
| Head of School | Student Teacher Ratio | Math Proficiency |
| Principal Philip Vanhooks | 15:1 | 1% |
| Reading Proficiency | ||
| 9% |
Niche Grade Details
Academics
| Reading Proficiency | Math Proficiency |
| 9% | 1% |
Teachers
| Student Teacher Ratio Teachers | Full Time Teachers |
| 15:1 26 | 26 |
| Teachers in First or Second Year | |
| 10.5% |
GreatSchools Rating Details
Teachers and Staff
| Students Per Counselor |
| 424:1 |
Student Diversity
| Male | Female | Black |
| 53.3% | 46.7% | 97.9% |
| Asian or Pacific Islander | White | Two or more races |
| <1% | <1% | <1% |
| Native American | Native Hawaiian or Other Pacific Islander | |
| <1% | <1% |
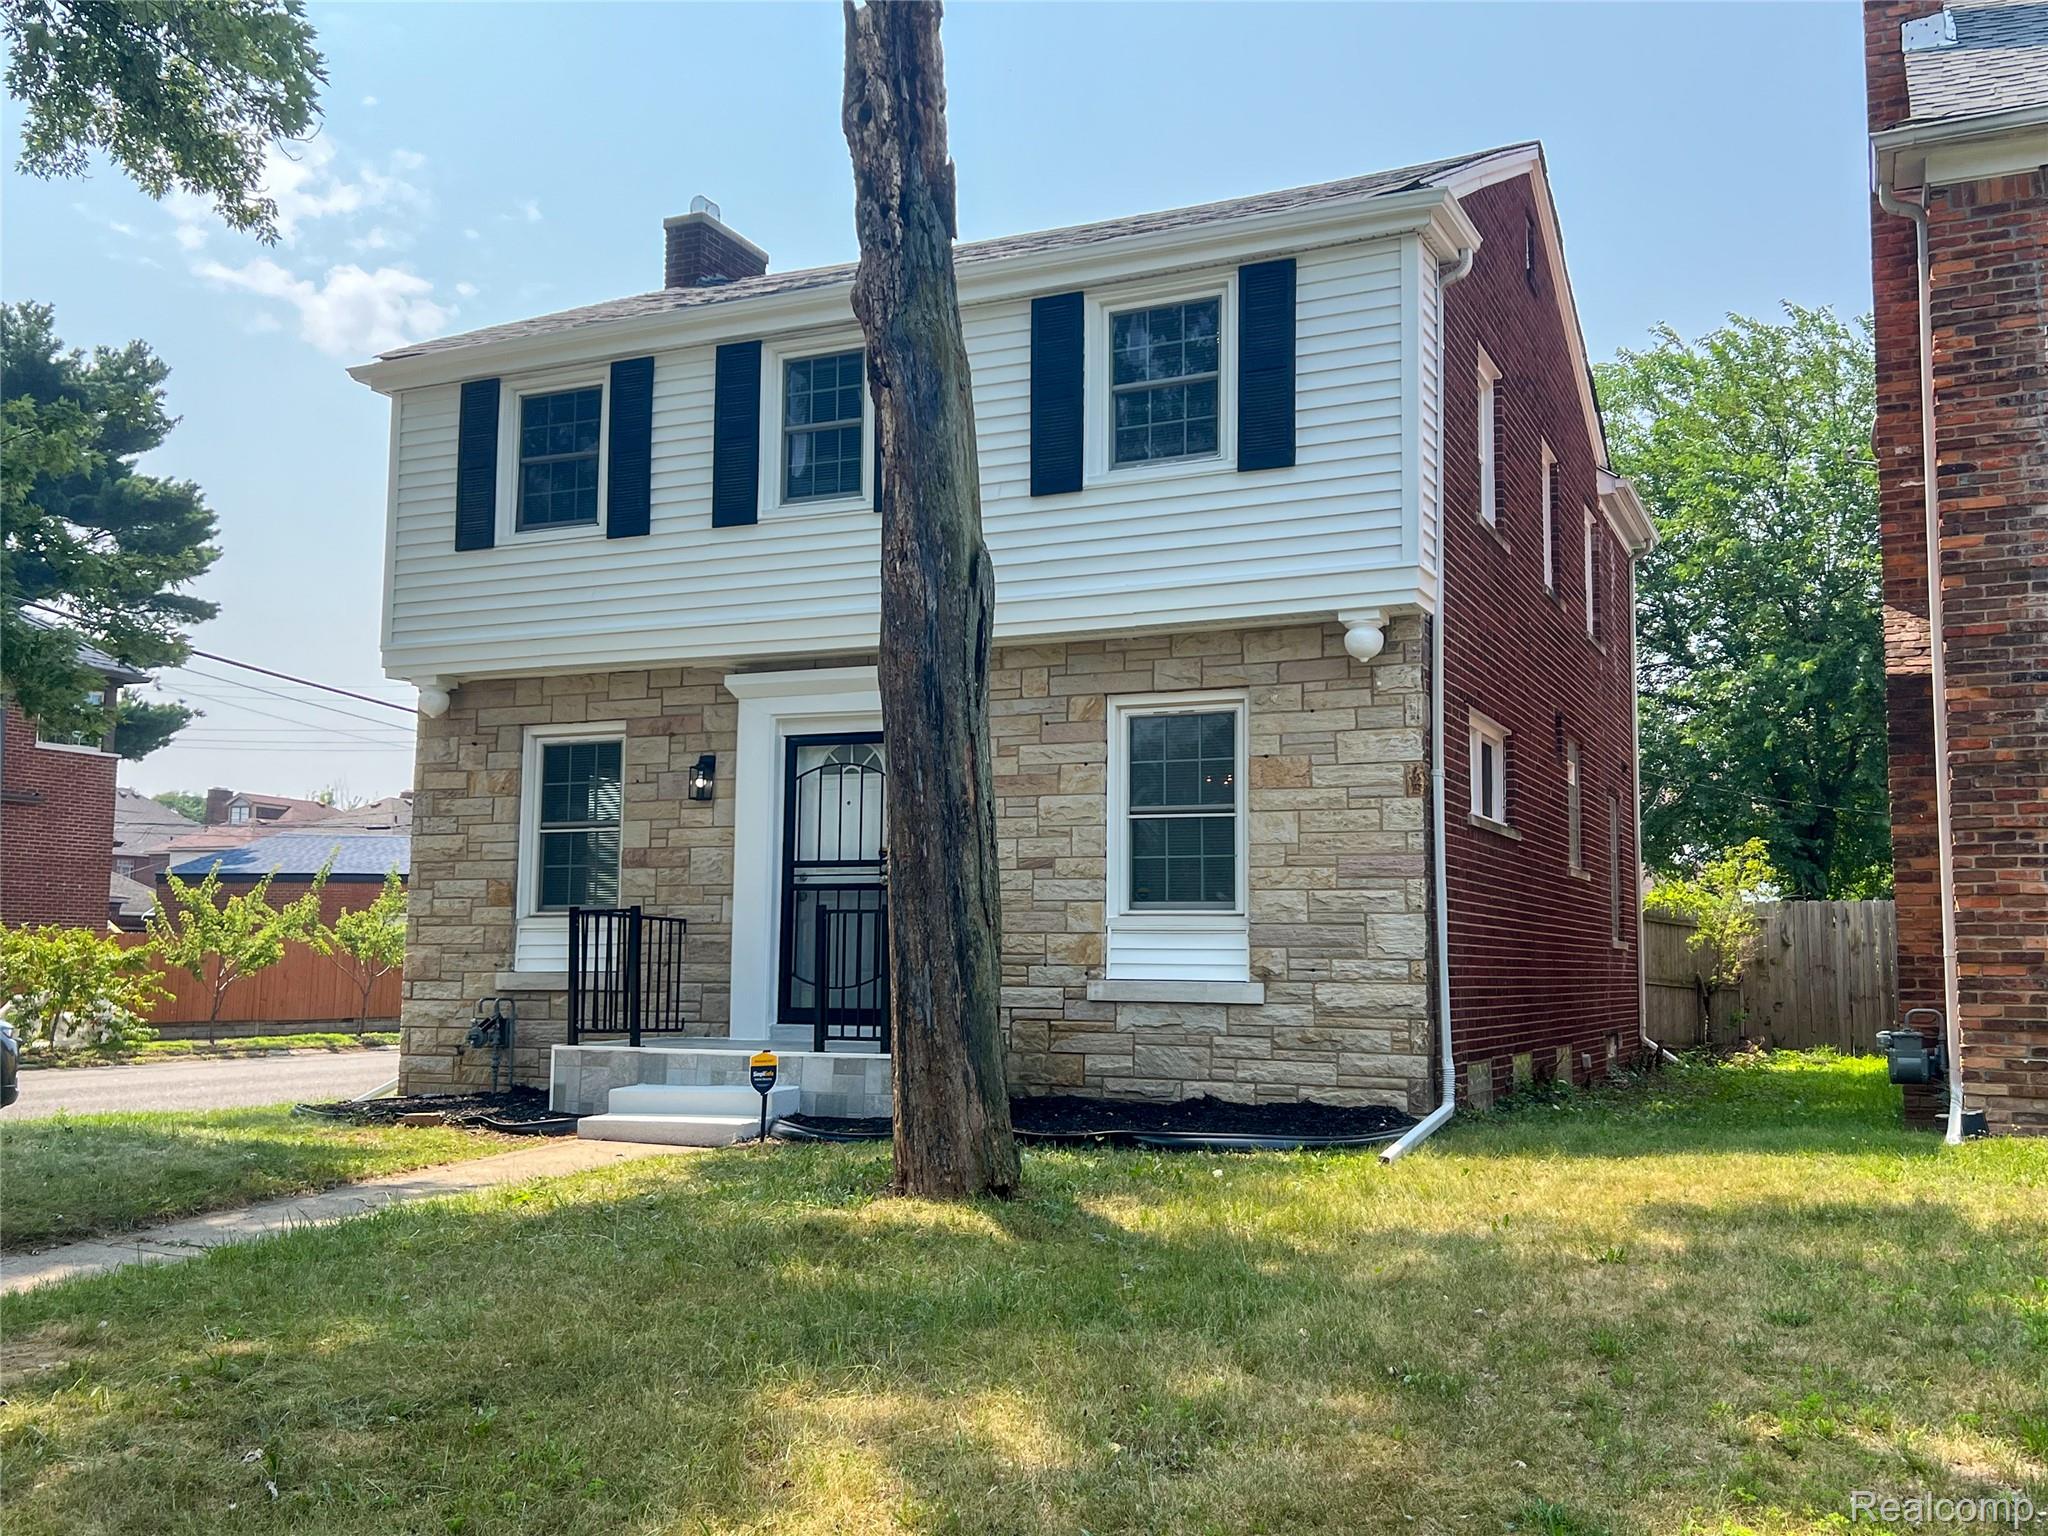
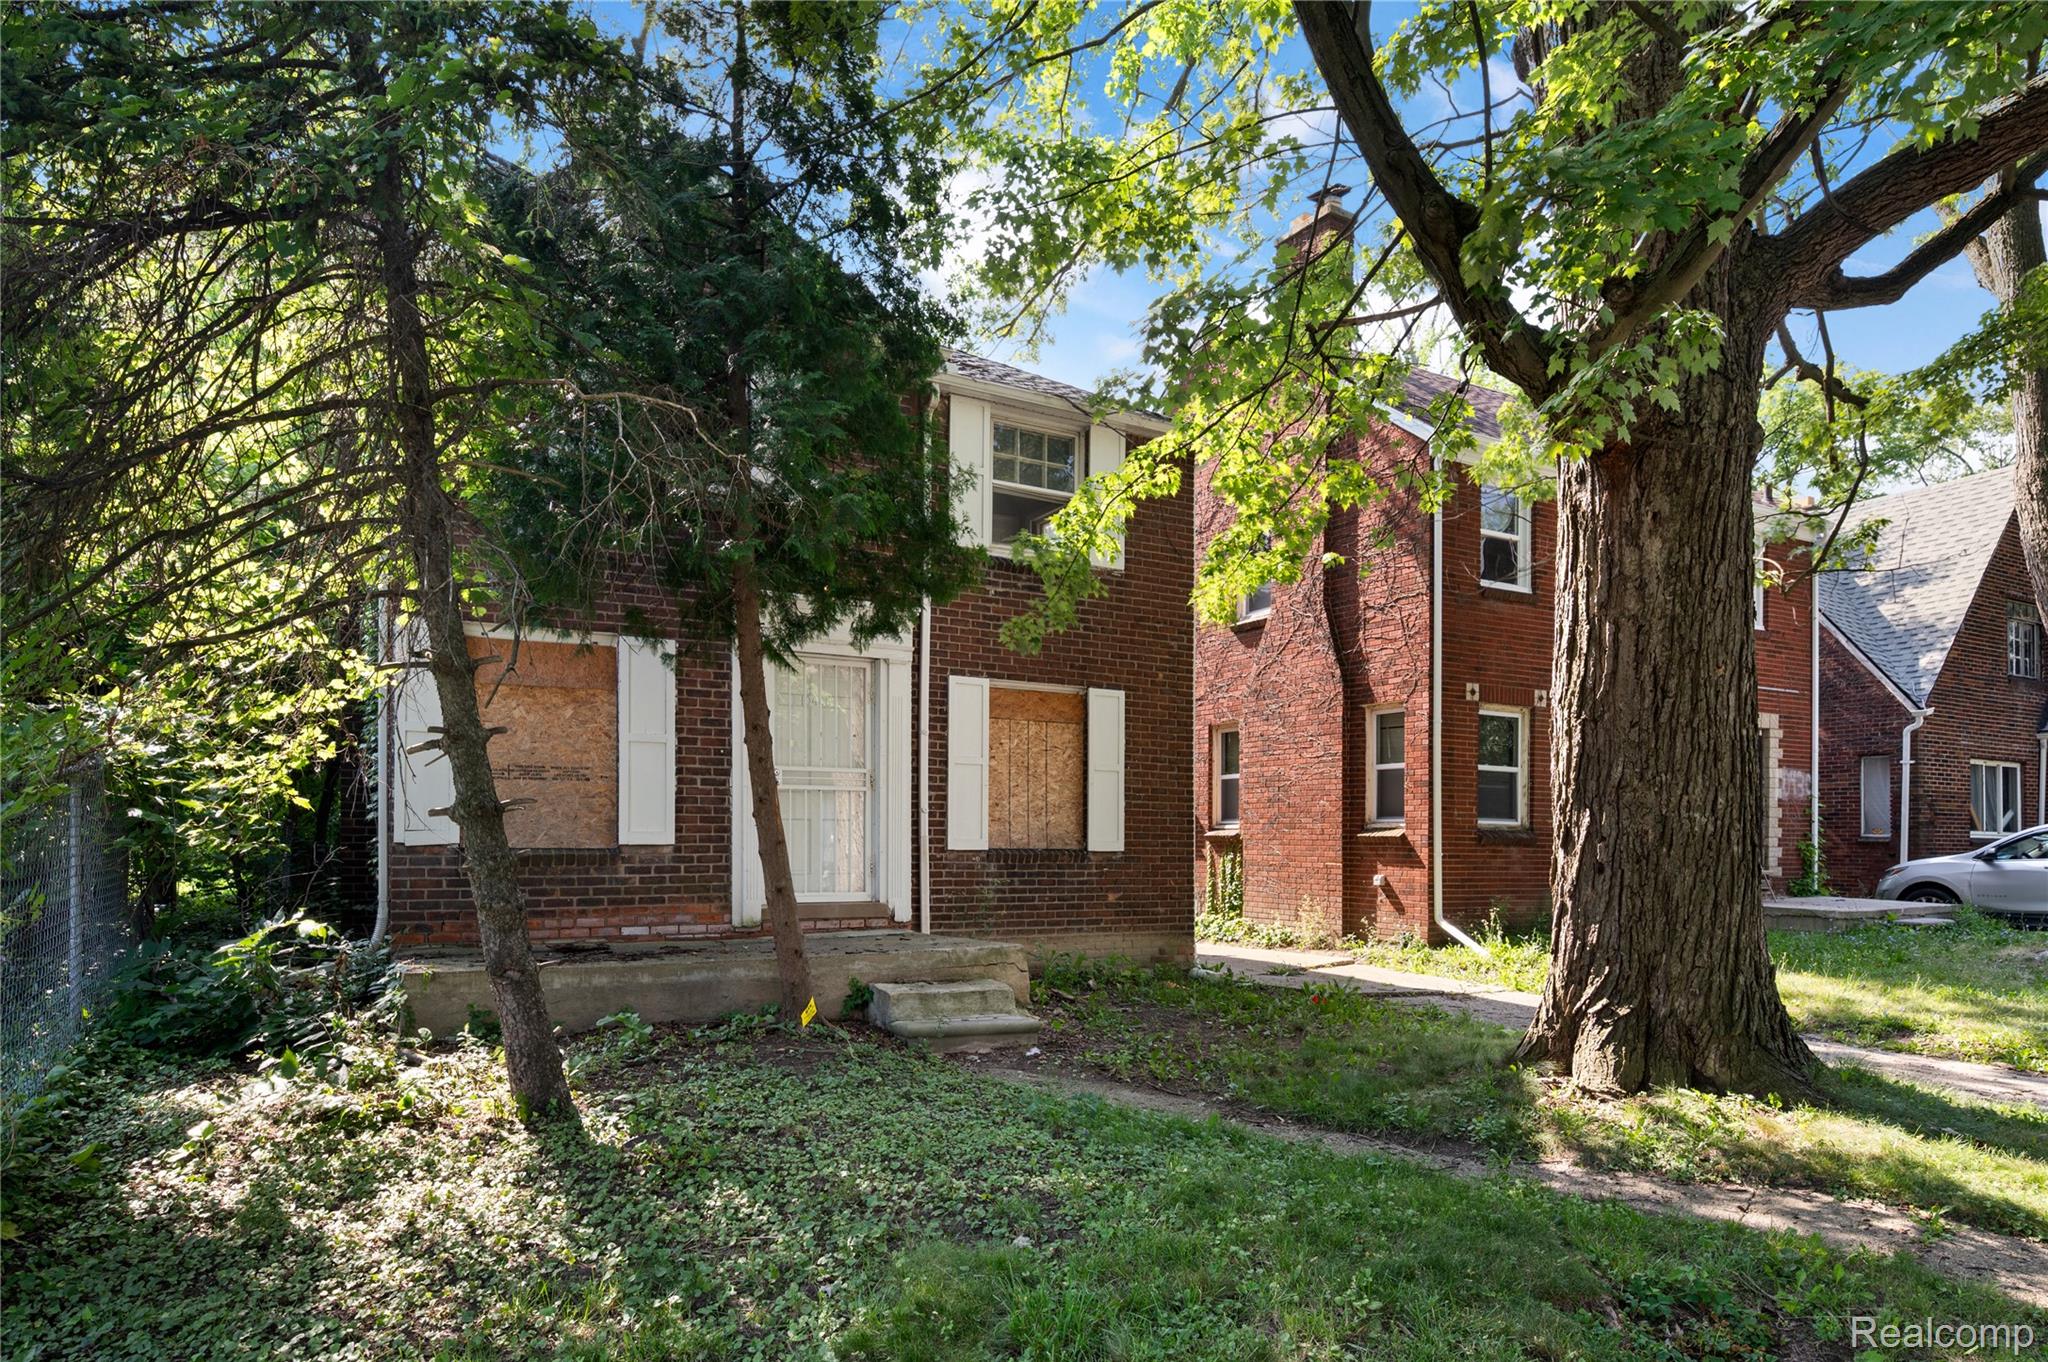
Interested in learning more about homes nearby? Reach out to LuQuandra Robinson, an experienced agent in this school’s attendance zone.
Specialty School Programs
Free/Reduced Lunch Offered
Agents Specializing in this Area
Map
About Farwell
Farwell is a residential neighborhood in northeast Detroit with a population of approximately 7,273. The area offers a suburban feel, featuring tree-lined streets and a variety of parks. Housing consists mainly of single-family homes, with a median lot size of 5,227 sq ft and a median home value around $60,000. The community is predominantly African American (95%) and has a median household income of $45,551. Farwell is known for its family-friendly atmosphere and affordability.
| List Price Range | Homes For Sale | Average Home Value | Median Lot Size |
| $27K – $141K | 30 | $71,952 | 5,227 Sq Ft |
| % Renters | Household Income | % of College Grads | Median Age |
| 40% | $52,000 | 12.2% | 36 |
| Average House Size | % Commercial Property | ||
| 1,378 Sq Ft | 40.0% |
Homes for Sale
See All Homes
Home Trends
Home Sales Trends
| Median Sale Price | Median Single Family Price | Average Price Per Sq Ft | Number of Homes for Sale |
| $60,000 | $63,400 | $63 | 30 |
| Last 12 months Home Sales | Months of Supply | Median List Price | Median Change From 1st List Price |
| 58 | 6.2 | $69,950 | 7% |
| Median Home Sale Price YoY Change | |||
| 11% |
Distribution of Home Values
Neighborhood Facts
| Number of Homes in Neighborhood | Median Year Built | Avg. Single Family Home Size Sq Ft Significantly below the national average | Average 2 Bedroom Size Sq Ft |
| 3,174 | 1948 | 1,378 1,936 | 800 |
| Median Lot Size Sq Ft | |||
| 5,227 |
Demographics
Area Demographics
| Total Population | Population Density | Median Age | Population under 18 On par with the national average |
| 7,273 | 9 ppl/acre | 36 | 28.5% 23.8% |
| Population over 65 On par with the national average | |||
| 16.3% 19.1% |
Finances
| Median Household Income Significantly below the national average | Average Household Income |
| $45,551 $71,702 | $52,000 |
Education and Workforce
| High School Graduates | College Graduates Below the national average | Advanced Degrees | % Population in Labor Force Below the national average |
| 87.6% | 12.2% 34.1% | 6.6% | 49.4% 65.1% |


 Please check your email for your login details.


